
Dividends are often seen as a sign of financial strength — but not all payouts tell the same story. While a high dividend may appeal to investors, its sustainability is what truly matters. Evaluating how and from where dividends are paid offers deeper insight into a company’s long-term financial health.
The Dividend Payout Ratio measures what portion of a company’s net earnings is paid out to shareholders as dividends. It is calculated as:
It can also be expressed as:
In simple terms, it shows how much of the company’s profit is distributed rather than retained for reinvestment.
Example:
| Net Profit | ₹100 Cr |
| Shares Outstanding | 5 Cr |
| Dividend Declared | ₹10 / share |
| Total Dividend | ₹50 Cr |
| Dividend Payout Ratio | 0.50 or 50% |
This indicates that half of the company’s earnings were returned to shareholders.
But Can a Company Pay More Than It Earns?
Yes — a company can pay dividends exceeding its reported net profit. This happens when it uses existing cash reserves to fund the dividend, even if the current period’s earnings are lower.
However, net profit is not the same as net cash. For example:
| Case 1 | Case 2 | |
| Revenue (Cash) | ₹150 Cr | ₹200 Cr |
| Revenue (Credit) | ₹50 Cr | ₹0 Cr |
| Expenses (Cash) | ₹100 Cr | ₹50 Cr |
| Expenses (Non-Cash) | 0 | ₹50 Cr |
| Net PRofit | ₹100 Cr | ₹100 Cr |
| Net Cash Inflow | ₹50 Cr | ₹150 Cr |
These variations explain why companies might show the same profit but vastly different cash positions.
Dividend to Operating Cash Flow Ratio
Another important metric is:
This ratio should ideally remain below 100% for long-term sustainability. If it exceeds 100%, the company must rely on investing or financing activities — or even deplete reserves — to support dividends.
So, What Should the Ratio Be?
Both payout ratios — based on net income and cash flow — should generally stay under 100%. A consistently high payout leaves little room for reinvestment. Companies giving out most of their earnings as dividends sacrifice their cheapest source of capital: retained earnings.
Accounting Treatment of Dividends
When dividends are declared:
- Cash is deducted from the Current Assets section of the balance sheet.
- An equivalent amount is subtracted from Reserves & Surplus under Shareholders’ Funds.
Unique Case: Investment Trusts (REITs & InvITs)
Interestingly, some listed Investment Trusts in India show dividend payouts exceeding 100% of net profit — and they still sustain.
If you look at any normal company, across any sector, a company cannot give dividends greater than 100% of its net income for many years continuously. So who manages to distribute more than they earn?
Investment Trusts give such a dividend.
You might wonder how they manage to survive. To understand this we need to study the mechanism and the financials behind this.
First let us look at the various InvTs.
Understanding Investment Trusts
Investment Trusts — including REITs (Real Estate Investment Trusts) and InvITs (Infrastructure Investment Trusts)— are vehicles that allow public investors to participate in income-generating assets such as office parks, roads, and power transmission lines. As of now, nine such trusts are listed in India, including:
- Embassy Office Parks REIT
- Nexus Select Trust
- Brookfield India Real Estate Trust
- IndiGrid Infrastructure Trust
- Mindspace Business Parks REIT
- PowerGrid Infrastructure Investment Trust
- Indus Infra Trust
- IRB INVIT FUND
- Capital Infra Trust
Let’s take IRB InvIT and Embassy REIT as examples to understand this concept further.
We’ll begin by examining the dividend payout ratio of both entities over the past few years.
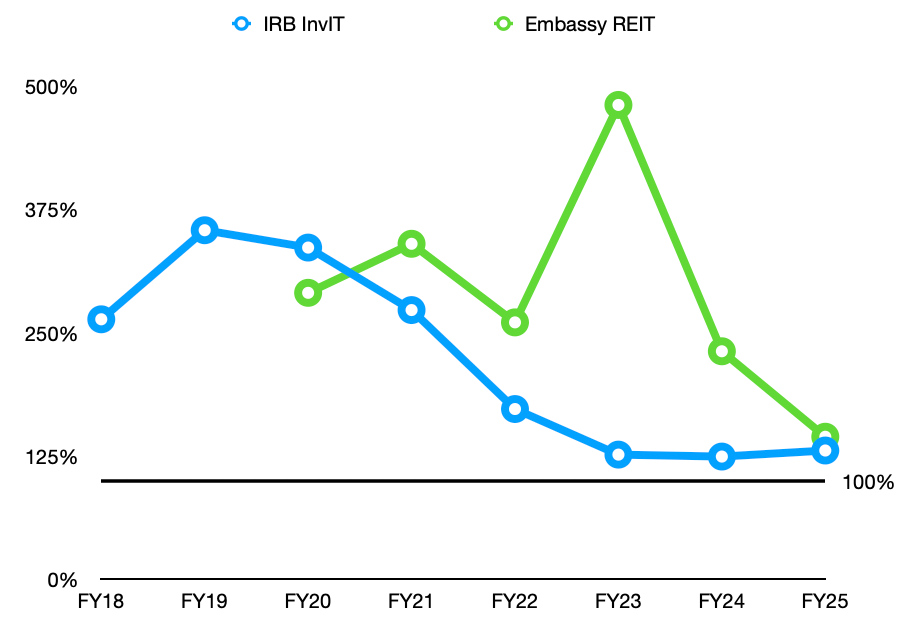
In both cases, the ratio has consistently remained above 100% for more than five years, indicating that they have been distributing more in dividends than their reported net earnings.
A similar pattern is observed in Mindspace Business Parks REIT, Brookfield REIT, and PowerGrid InvIT.
Moreover, if you look at the Reserves and Surplus section of their balance sheets, you’ll find negative values — a direct result of dividend distributions exceeding net income.
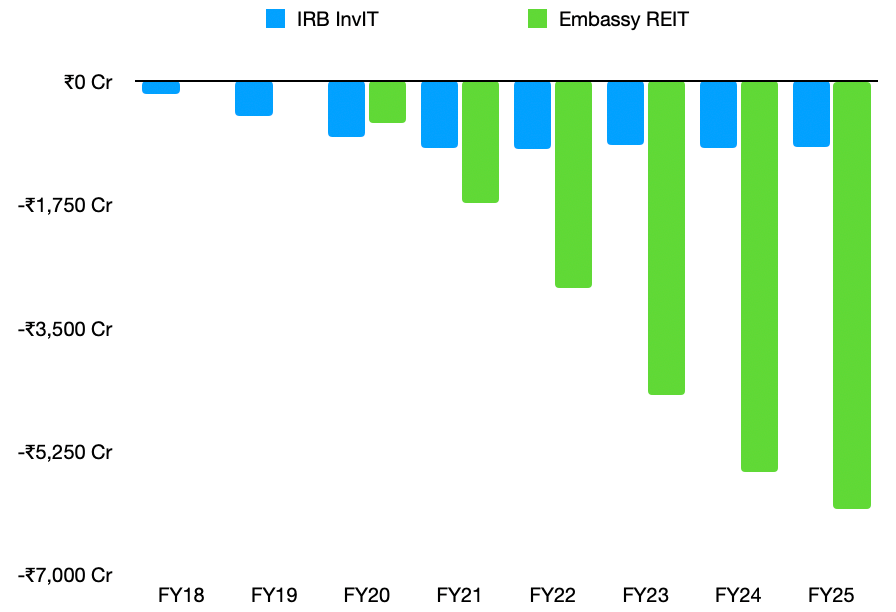
Negative and declining Reserves and Surplus indicate that these companies have been consistently distributing more in dividends than their net income. Since net income is added to, and dividends are deducted from, Reserves and Surplus, this results in a negative balance over time.
This raises two important questions:
- How are these businesses surviving?
- Are these businesses fundamentally strong?
Why Dividends Can Exceed Net Income
Unlike traditional companies, their objective is not growth through retained earnings, but rather distribution of steady income to unit holders.
These trusts are governed by a very different set of rules — both financial and regulatory. Here’s why their dividends regularly exceed reported profits:
- As per SEBI norms, Investment Trusts are required to distribute at least 90% of their Net Distributable Cash Flow (NDCF) to unit holders. This ensures a steady return stream to investors.
- The underlying assets — whether office spaces or infrastructure — are long-term, income-generating in nature. These provide predictable and recurring cash flows.
- These businesses have large capital assets that undergo heavy depreciation, significantly reducing accounting profits. But since depreciation is a non-cash expense, it doesn’t impact the cash actually available for distribution.
- Unlike tech or manufacturing companies, REITs and InvITs do not need to retain earnings for R&D or expansion. Most of their growth comes through external fund-raising or acquisitions, not internal cash retention.
How REITs Grow Despite High Payouts
It may seem that high dividends would stunt future growth. However, REITs grow through:
- Acquisitions: Funded through debt or issuance of units.
- Lease Escalations: Most commercial leases include annual rental increases.
- NAV Appreciation: Asset value growth over time increases investor wealth.
Embassy REIT, for instance, continues expanding its asset base while maintaining high distributions.
Net Distributable Cash Flow (NDCF)
| Cashflows from operating activities of the Trust |
| (+) Cash flows received from SPV’s / Investment entities |
| (+) Treasury income / income from investing activities |
| (+) Proceeds from sale of investments |
| (-) Finance cost on Borrowings, excluding amortisation |
| (-) Debt repayment at Trust level |
| (-) any reserve required to be created |
| (-) any capital expenditure on existing assets |
| NDCF at Trust Level |
The Net Distributable Cash Flow (NDCF) is the actual cash available for distribution to unit holders after adding all cash inflows—like operating income, cash received from SPVs, investment returns, and asset sale proceeds—and subtracting essential outflows such as loan repayments, finance costs, mandatory reserves, and capital expenses. It represents the true, spendable cash that the trust can pass on to investors, as per regulatory guidelines.
Let us look at Embassy Office Parks REIT.
| Particulars | Q4 FY2025 | Q4 FY2024 | Variance (%) | FY2025 | FY2024 | Variance (%) |
| Revenue from Operations | 10858 | 9458 | 15% | 40389 | 36852 | 10% |
| Property Taxes and Insurance | -390 | -360 | 8% | -1462 | -1371 | 7% |
| Direct Operating Expenses | -1544 | -1443 | 7% | -6093 | -5661 | 8% |
| Net Operating Income | 8924 | 7656 | 17% | 32834 | 29819 | 10% |
| Other Income | 82 | 379 | -78% | 1122 | 1682 | -33% |
| Dividends from Embassy GolfLinks | 175 | 175 | 0% | 1003 | 700 | 43% |
| Property Management Fees | -220 | -181 | 21% | -851 | -766 | 11% |
| Indirect Operating Expenses | -280 | -264 | 6% | -1024 | -963 | 6% |
| EBITDA | 8682 | 7764 | 12% | 33086 | 30472 | 9% |
| Working Capital Adjustments | 132 | -448 | -129% | 1249 | -581 | -315% |
| Cash Taxes | -310 | 106 | -392% | -1384 | -1008 | 37% |
| Principal Repayment on external debt | 0 | -1 | NA | NA | NA | NA |
| Interest on external debt | -1684 | -1041 | 62% | -5983 | -3333 | 79% |
| NDCF at SPV level | 6819 | 6380 | 7% | 26968 | 25547 | 6% |
| Distribution from SPVs to REIT | 6818 | 6365 | 7% | 26956 | 25756 | 5% |
| Distribution from Embassy Golflinks | 284 | 470 | -40% | 1728 | 2074 | -17% |
| Interest on external debt (Trust) | -1533 | -1797 | -15% | -6426 | -7207 | -11% |
| REIT Management Fees | -67 | -58 | 15% | -258 | -238 | 8% |
| Trust level expenses, net of income | -94 | -22 | 328% | -240 | -138 | 73% |
| Working Capital changes | -11 | 0 | NA | 85 | NA | NA |
| NDCF at REIT level | 5397 | 4958 | 9% | 21846 | 20427 | 8% |
| Distribution | 5384 | 4948 | 9% | 21811 | 20219 | 8% |
A glance at the above statements:
| FY25 | |
| NDCF at SPV Level | ₹2,696 Cr |
| NDCF at Trust Level | ₹2,184 Cr |
| Distribution (Dividends) | ₹2,181 Cr |
| Net Income | ₹1,624 Cr |
This statement shows how the NDCF is calculated on the trust level for a REIT. Also how it differs from Net Income and is used in calculations for the distributions (dividend).
Tax Treatment for Investors
REIT distributions can come in different forms, each taxed differently:
- Interest Income: Taxed at slab rate; 10% TDS applies over ₹5,000
- Dividend Income: Tax-free if SPV hasn’t opted for 22% concessional tax regime; otherwise taxed at slab
- Capital Gains on REIT Units: 20% (short term), 12.50% (long term)
- Rental Income: Taxed at the REIT level, not passed through
Investors should be aware of these nuances, especially since dividend taxation may affect net returns.
Investor Perspective: Should You Be Concerned?
Not at all — as long as you evaluate the right metrics. For REITs and InvITs, cash flow is king, not net profit. Look at their NDCF, debt position, lease structure, and occupancy rates.
These entities are ideal for investors seeking passive income with stability, especially in a high-interest, high-volatility environment. Historically, U.S. REITs have outperformed the S&P 500, and Indian REITs are showing similar promise.
Conclusion
The traditional dividend payout ratio loses meaning when applied to REITs and InvITs. Their model is based on cash generation, not profit maximisation, making them a valuable income-generating asset class in an investor’s portfolio. As long as investors understand their mechanics and evaluate them differently from traditional companies, these trusts can offer both yield and growth potential.
As REITs and InvITs continue gaining traction among Indian investors, understanding their financial nuance is critical. Focus on cash flows, not earnings. And above all, invest with clarity, not assumptions.
Sources:


Leave a comment