
Reserve Bank of India
The Reserve Bank of India, or RBI, is the central bank of India. It is responsible for maintaining liquidity in the economy, managing inflation, and driving economic growth by controlling the money supply.
There are several tools that the RBI uses to manage this.
Repo Rate
Repo Rate is the interest rate at which commercial banks borrow money from the central bank by pledging government securities, with an agreement to repurchase them at a later date.
This helps commercial banks meet their short-term fund requirements and ensures liquidity in the banking system.
- When the RBI increases this rate, the cost of borrowing for commercial banks rises. As a result, borrowing reduces, leading to lower liquidity in the economy.
- When the RBI decreases this rate, the borrowing cost falls. This encourages banks to borrow more, thereby increasing liquidity in the economy.
Reverse Repo Rate
Reverse Repo Rate is the interest rate at which the central bank borrows money from commercial banks.
This helps absorb excess liquidity from the banking system, while the banks earn interest on the funds parked with the RBI.
- When the RBI increases this rate, the return for commercial banks becomes more attractive. Banks deposit more with the RBI, reducing liquidity in the market.
- When the RBI lowers this rate, the return decreases. Banks prefer to use their funds elsewhere, increasing liquidity in the economy.
Cash Reserve Ratio (CRR)
Cash Reserve Ratio is the minimum percentage of a bank’s total deposits that it must keep with the RBI. This acts as a safety reserve for emergencies.
- Increasing this ratio means banks have to deposit more with the RBI, which reduces liquidity in the banking system.
- Decreasing it allows banks to retain more funds, increasing liquidity.
Statutory Liquidity Ratio (SLR)
SLR is the percentage of a bank’s deposits that must be held in the form of government-approved securities.
- Increasing the SLR reduces liquidity, as more funds are tied up in securities.
- Decreasing it frees up funds, increasing liquidity in the system.
Marginal Standing Facility (MSF)
MSF allows banks to borrow funds from the RBI overnight using government securities as collateral. It acts as a safety valve for short-term liquidity and sets the upper limit for interest rates in the system.
- A higher MSF rate makes borrowing costlier, reducing liquidity.
- A lower MSF rate encourages borrowing, increasing liquidity.
Standing Deposit Facility (SDF):
SDF enables banks to deposit excess funds with the RBI overnight without the need for collateral. It has replaced reverse repo as the floor of the Liquidity Adjustment Facility (LAF) corridor.
- When the SDF rate is increased, banks earn more by parking funds, which reduces liquidity.
- When the rate is decreased, the incentive drops, and liquidity in the system increases.
These tools may seem complex at first but revolve around two core ideas:
- Changing borrowing and deposit rates to influence banking behaviour.
- Mandating reserve requirements to absorb or release liquidity.
Why Does Liquidity Matter?
Higher liquidity allows banks to issue more loans to businesses and consumers, increasing money flow in the economy, which supports growth and inflation.
On the other hand, lower liquidity reduces money supply, slowing down growth and controlling inflation.
When growth is stagnant and inflation is low, central banks try to inject liquidity to stimulate the economy without risking inflation.
But once inflation exceeds comfortable levels, the central bank pauses or reverses this liquidity support to keep inflation in check — even if it comes at the cost of slowing growth.
Background
The RBI Monetary Policy Committee, on 6th June, announced a rate cut. While a rate cut was widely expected, few anticipated a 50 basis points cut — especially after two consecutive 25 bps cuts in the previous two policy meetings. This brings the total rate cuts for the year to 100 basis points.
Updated Rates:
- Repo Rate – 5.50%
- Standing Deposit Facility – 5.25%
- Marginal Standing Facility – 5.75%
- Bank Rate – 5.75%
Rationale behind the decision:
- Inflation has softened over the past six months, falling from levels above the tolerance band of 4% ± 2%. While it still remains slightly above 4%, the RBI expects inflation to fall below its target over the coming year. This reduces the risk of inflation rising due to a rate cut. In line with this outlook, the inflation forecast for the year has been revised down from 4.0% to 3.7%.
- At the same time, growth remains subdued and below expectations, largely due to a challenging global environment and ongoing uncertainties. The policy move is therefore intended to stimulate domestic private consumption and investment activity.
This changed growth-inflation dynamics calls for not only continuing with the policy easing but also frontloading the rate cuts to support growth. — RBI Governor Sanjay Malhotra
Where does this bring us?
A cumulative rate cut of 100 basis points since February 2025 has brought us to a stage where the RBI now has limited room left to support growth through further rate cuts. As a result, the RBI has shifted its stance from accommodative to neutral.
| Inflation | GDP Growth | |
| Q1 | 2.90% | 6.50% |
| Q2 | 3.40% | 6.70% |
| Q3 | 3.90% | 6.60% |
| Q4 | 4.40% | 6.30% |
| FY26 | 3.70% | 6.50% |
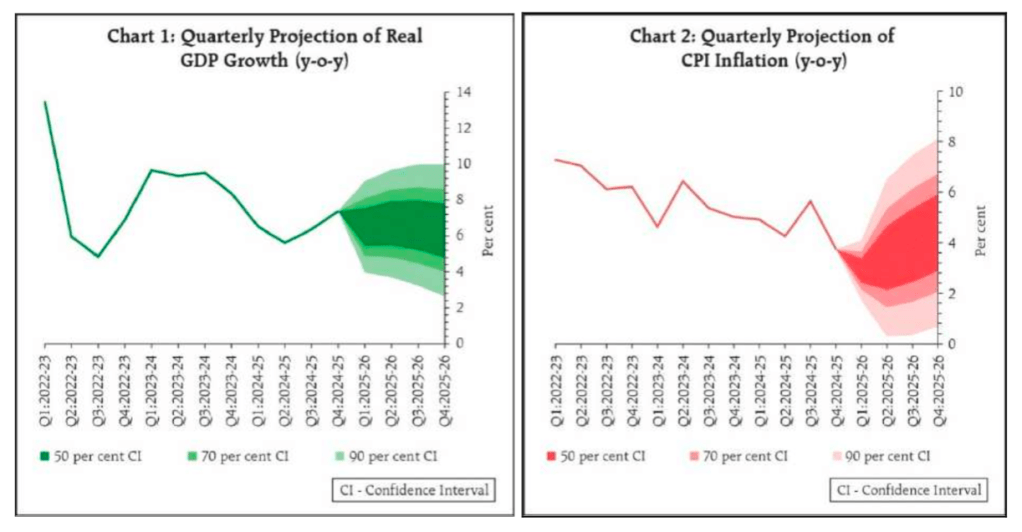
The images show that, due to both global uncertainties and the rate cuts introduced this financial year, GDP growth is projected to decline, while inflation is expected to rise.
This covered the basics of interest rate policy and its impact on the economy. Now let’s understand what it did to the stock market and its various sectors.
Effect on Stock Market:
| Index | Change (%) | Advance | Decline | A/D (%) |
| Nifty 50 | 1.02% | 45 | 5 | 90% |
| Nifty Bank | 1.47% | 10 | 2 | 83% |
| Nifty Auto | 1.52% | 13 | 2 | 87% |
| Nifty IT | 0.50% | 10 | 0 | 100% |
| Nifty PSU Bank | 0.58% | 6 | 6 | 50% |
| Nifty Fin Service | 1.75% | 18 | 2 | 90% |
| Nifty Pharma | 0.19% | 11 | 9 | 55% |
| Nifty FMCG | 0.31% | 9 | 6 | 60% |
| Nifty Metal | 1.90% | 13 | 1 | 93% |
| Nifty Realty | 4.68% | 9 | 1 | 90% |
| Nifty Media | -1.14% | 0 | 9 | 0% |
| Nifty Energy | 0.28% | 28 | 12 | 70% |
| Nifty Pvt Bank | 1.79% | 9 | 1 | 90% |
| Nifty Infra | 0.67% | 27 | 3 | 90% |
| Nifty Commodities | 1.21% | 25 | 5 | 83% |
| Nifty Consumption | 1.14% | 25 | 5 | 83% |
| Nifty PSE | 0.78% | 16 | 4 | 80% |
| Nifty Services | 1.16% | 24 | 5 | 83% |
| Nifty FinSrv25/50 | 2.09% | 18 | 2 | 90% |
| Nifty Cons Durbl | 1.32% | 13 | 2 | 87% |
| Nifty Healthcare | 0.52% | 12 | 8 | 60% |
| Nifty Oil & Gas | 0.57% | 10 | 5 | 67% |
| Nifty India Mfg | 0.79% | 50 | 26 | 66% |
The table above reflects the movement and Advance-Decline (A/D) ratio of all NSE sectoral indices on 6th June — the day the RBI policy was announced. The data shows that the rate cut was received positively across most sectors, except for Media (which posted a negative return) and a few sectors like Pharma, Healthcare, Oil & Gas, Manufacturing, and PSU Banks, which had a more neutral response (A/D below 70%).
Let’s break down the impact across different sectors:
Highly Positive
Sectors such as Auto, Realty, Private Banks, and Financial Services showed strong gains. These sectors are directly influenced by rate cuts:
- Lower interest rates reduce the cost of borrowing for consumers, leading to increased demand for automobiles and real estate.
- Private Banks and Financial Services benefit as their borrowing costs decline and credit demand rises.
- As demand and GDP rise, the consumption of Metals also increases — explaining the 1.90% rise in the Metals index and its strong 93% A/D ratio.
Moderately Positive
Sectors like IT, PSU Banks, Commodities, Consumption, Services, and Consumer Durables saw moderate gains:
- These sectors benefit from broader economic growth triggered by lower interest rates.
- Since they make up a major portion of the market, any GDP uptick tends to boost performance.
- PSU Banks do benefit from rate cuts but may not leverage lower borrowing costs as efficiently as Private Banks due to operational inefficiencies.
Neutral
Neutral doesn’t imply no movement — rather, it reflects a limited upside or a weaker A/D ratio. Sectors falling into this category include:
- Pharma, FMCG, Energy, Infrastructure, PSE, Healthcare, Oil & Gas, and Manufacturing.
Some might argue that increased consumer purchasing power would boost Pharma and FMCG sales. But in practice, such gains are usually redirected toward large-ticket purchases like Automobiles and Real Estate.
Also, these sectors are sensitive to inflation. Rate cuts often come with rising inflation expectations, which raise input costs — offsetting any benefits from broader growth.
Other sectors like Infra, PSE, Energy, and Manufacturing benefit more indirectly, and over the long term, as GDP expansion supports their demand gradually.
Negative
Only Media showed a decline on that day.
- Media isn’t directly impacted by interest rate movements.
- It likely saw outflows due to sector rotation — as investors redirected attention to more promising sectors following the rate cut.
- The fall appears to be sentiment-driven rather than fundamentally linked to the policy announcement.
Debt Market
The debt market is directly impacted by interest rate changes. When the RBI cuts rates, the interest income earned by investors from newly issued bonds goes down. As a result, older bonds with higher interest rates become more attractive and increase in value.
We can broadly divide bonds into two categories — short-duration and long-duration bonds.
Short-duration bonds are those with maturities ranging from overnight to a few years. Since they mature quickly, their prices don’t react much to interest rate changes. They are less sensitive to market fluctuations.
Long-duration bonds, usually with maturities of 5 years or more, react strongly to interest rate changes. The longer the duration, the greater the impact. That’s because any difference between the old bond’s coupon and the new bond’s coupon will apply over many years — which compounds the effect.
This difference is reflected in the price movement of bonds. If interest rates fall, older bonds with higher coupons get more demand, and their price rises until their Yield to Maturity (YTM) matches that of new bonds.
Example:
| Bond | Issue Price | Coupon | Rate Cut | Duration | New NAV | Return |
| A | ₹100 | 6% | 50 bps | 2 Years | ₹100.92 | 0.92% |
| B | ₹100 | 6% | 50 bps | 20 Years | ₹105.97 | 5.97% |
Reality
In the real market, bonds with maturities up to 5–7 years saw a rise in value. However, longer-duration bonds (20–25 years) actually fell (~1% to 1.5%).
Here are two key reasons for this:
- Rate cuts were already priced in. Long-duration bonds had already risen ~5% in the last quarter and ~10% in the past year. With a YTM of ~6–8%, the upside from further rate cuts seemed limited.
- RBI changed its stance to neutral. This made markets doubt the possibility of more rate cuts in the near term. A neutral stance signals that rates may remain stable or even rise if inflation climbs. That flattens the yield curve and limits further gains in long-duration bonds.
After having reduced the policy repo rate by 100 bps in quick succession since February 2025, under the current circumstances, monetary policy is left with very limited space to support growth. — RBI Governor Sanjay Malhotra
Also, long-duration bonds carry more credit risk over time, so when economic certainty reduces, investors prefer shorter tenures.
Finally, the strong performance in equity markets likely triggered sector rotation — shifting capital from bonds to stocks — adding to the pressure on bond prices.
Conclusion
The RBI’s 50 bps rate cut, coupled with a shift in stance from accommodative to neutral, marks a significant point in India’s monetary policy journey this year. With inflation expected to stay below target and growth still facing global headwinds, the central bank has chosen to frontload support while there is room to act. However, with limited space for further rate cuts, the focus now shifts to how effectively this policy translates into real economic momentum. Markets, too, are expected to respond in phases, with sector-specific movements and debt market reactions continuing to unfold. The path ahead will require careful observation of incoming data, but for now, the RBI has played its hand decisively.
Sources:


Leave a comment