
Stock Results
A company publishes its performance results for a particular time period—Quarterly, Half-Yearly, 9-Monthly, or Yearly. These results reflect how the company performed and help in understanding its position in the market, whether it did well or not compared to peers.
Common Beliefs
There are two common beliefs among investors and traders regarding stock results and their effect on stock prices:
- The Straightforward Assumption:
Some believe that good results cause stock prices to rise, and bad results make them fall. This belief is based on the efficiency hypothesis that a well-performing company will be rewarded by the market, and a poorly performing one will be punished.
- The Market-Factoring Theory:
Others argue that the market prices in expectations beforehand. So, even a 40% rise in profits may disappoint the market if it expected 60%, and a 90% drop in profits may beat expectations if a total loss was feared.
In this view, results are already ‘factored in’. This leads some to believe in strategies like:
- “Sell on good results, because they were expected.”
- “Buy on bad results, because the worst may be over.”
We attempt to evaluate how much results truly matter in the short term, and whether any reliable trend can be identified.
Analysing Results
Analysing results is tricky. Many external factors—sector trends, global economic situations, political turmoil, supply chain disruptions—can influence the numbers. However, two metrics remain most directly affected: Revenue and Net Profit.
We evaluated performance on both Quarter-on-Quarter (QoQ) and Year-on-Year (YoY) basis:
- QoQ: Q4FY25 vs Q3FY25
- YoY: Q4FY25 vs Q4FY24
We gave a point-based score:
| Revenue | Net Profit | |
| Improving (QoQ) | 1 | 1 |
| Declining (QoQ) | -1 | -1 |
| Improving (YoY) | 1 | 1 |
| Declining (YoY) | -1 | -1 |
So, a company can score between +4 (very good results) and -4 (very bad results).
Results with a net score of 0 were treated as neutral and excluded from deeper analysis.
Sample Size
We took the 5 largest companies in 5 major sectors:
- Reliance Industries (Refinery / Conglomerate)
- HDFC Bank (Financials)
- Tata Consultancy Services (IT)
- Bharti Airtel (Telecom)
- Hindustan Unilever (FMCG)
We analysed 20 quarterly results per company, making the total 100 result events.
Stock price movements were recorded on:
- The next trading day
- 7 days, 14 days, and 30 days post result
If any of these days fell on a holiday, the next trading day was considered (previous trading day in case of holiday on result date).
To understand if markets preempt results, we also analysed stock movement 7 days before the results.
Analysis
Step 1: Classified results as positive, negative, or neutral based on our point system.
Step 2: Removed neutral results.
Step 3: Checked how often stock prices moved in line with result sentiment:
- Up after good results
- Down after bad results
If a stock gave good results but fell, or gave bad results but rose, it was marked as against the sentiment.
For Example
| Quarter | Results | Stock Movement |
| Q1 | Positive | 5% |
| Q2 | Negative | 2% |
| Q3 | Positive | -8% |
| Q4 | Negative | 1% |
In the above example, 75% of the time stocks moved against the result sentiment—i.e., prices fell on good results and rose on bad ones.
Results
There is no strong or reliable correlation between stock price movement and company results.
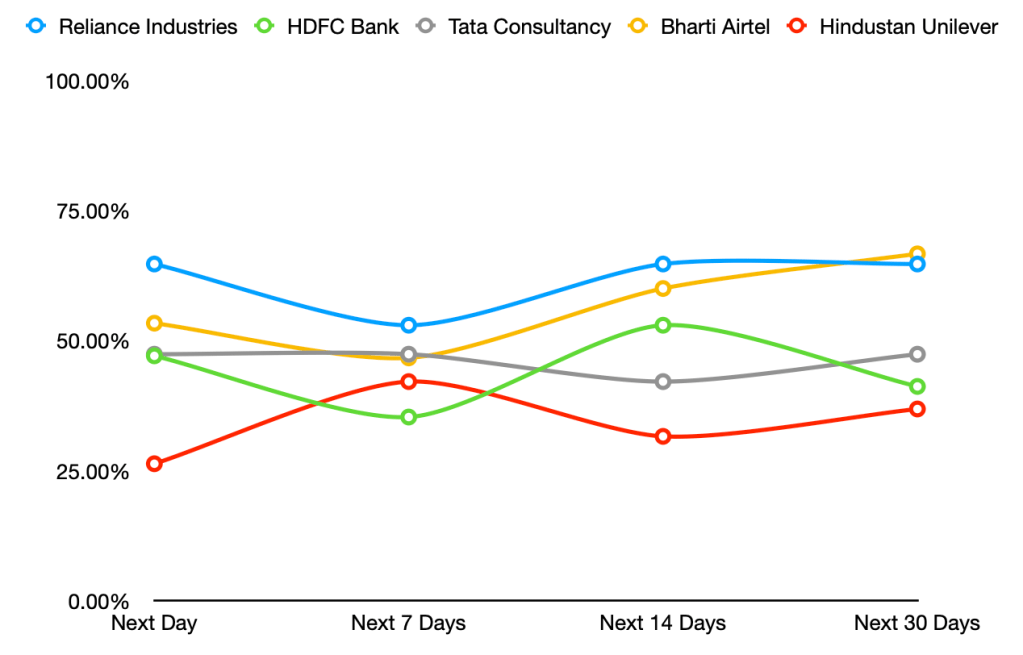
To analyse the graph above, the line represents the percentage of times the stock moved in the direction of the result—rising on good results and falling on bad results—over each time interval.
The higher this percentage, the stronger the trend of stock prices following the results. On the other hand, a lower percentage indicates that prices often moved opposite to what the results suggested.
However, since the range stays between 30% and 70%, it shows that there is no strong or consistent relationship between stock movements and company results. This makes it difficult to draw a firm conclusion.
So, what if the stock reacts before the results are announced? Let’s look at stock movement in the 7 days prior to the results.

Once again, only slight correlation was seen—specifically in HDFC Bank, where the stock often fell before good results and rose before bad ones, showing a negative correlation. But since this pattern was observed in just one out of five stocks, it is not enough to suggest that short-term price movement consistently factors in the upcoming results.
Do Prices Really Factor In?
Yes, the market does factor in everything—either before or after results. But it’s not consistent. Some reactions happen instantly, some over days or even weeks. So, timing trades based on results alone is unreliable.
Only when something is unexpected (i.e., not already factored in) do we see sharp moves—like gap-up or gap-down openings, or high intraday volatility. The market rewards clarity and penalises surprises.
Conclusion
The analysis reveals that stock prices do not consistently move in direct correlation with quarterly results. While one might expect good results to trigger a rise and bad results to cause a fall, the actual price behavior shows mixed patterns across different stocks. With correlations ranging between 30% and 70%, and only one notable exception (HDFC Bank showing a negative pre-result movement), the data suggests no reliable relationship strong enough to base short-term trades on result expectations. Investors should therefore be cautious in predicting market moves solely based on upcoming earnings and instead consider broader trends and fundamentals.
Sources:


Leave a comment